


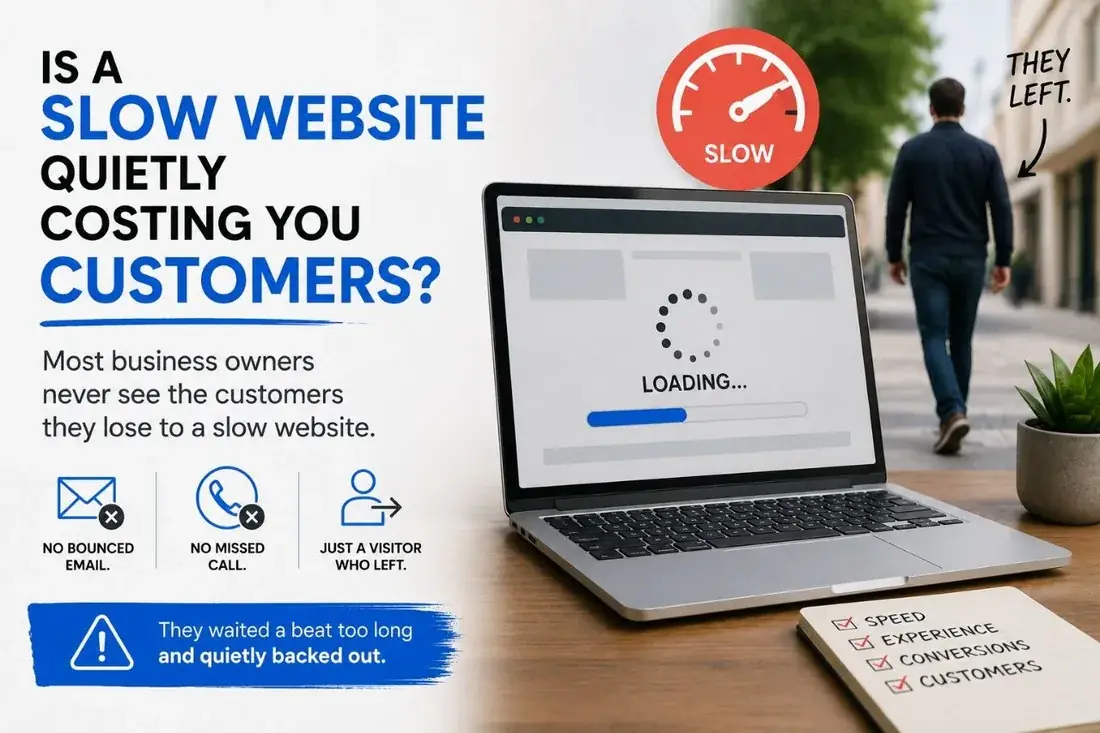


If your site takes more than three seconds to become usable on a mid-range Android phone over a 4G connection, you are losing customers you never knew you had. They arrive, they wait, they bounce. They will not write you an angry email about it — they just disappear, and you see it in the analytics as a high exit rate on the landing page.
The performance gap between a fast site and a slow one is now the single largest source of "invisible churn" we find when auditing new NTL of NYC clients. It is also one of the easiest things to fix once someone actually looks at the numbers.
- A site slower than 3 seconds on mobile bleeds customers as silent, invisible churn.
- Google grades Core Web Vitals: LCP under 2.5s, INP under 200ms, CLS under 0.1.
- Usual culprits: oversized images, render-blocking scripts, heavy JS, no CDN or caching.
- Going from a 35 to 85 Lighthouse score typically cuts bounce 10–25% — no redesign needed.
The three numbers Google grades you on
Google's Core Web Vitals are the public scoreboard for site performance. Three metrics:
- LCP (Largest Contentful Paint) — how long before the biggest visible element on the page (usually the hero image) has rendered. Target: under 2.5 seconds. Bad: over 4.
- INP (Interaction to Next Paint) — how long the page takes to respond to a tap or click. Target: under 200 milliseconds.
- CLS (Cumulative Layout Shift) — how much the layout jumps around as the page loads. Target: under 0.1. (The classic offender: an ad slot that pushes the article down half a second after you started reading.)
Google rolls these into its ranking signals. A site that fails Core Web Vitals is being held back from rankings it would otherwise earn — even before the human conversion impact.
What we look at on a performance audit
An NTL audit on a slow site usually surfaces 8–12 distinct fixes. The common culprits, in order of how often we find them:
- Hero images served at desktop resolution to mobile devices. A 4MB image on a phone has no business being there. The fix: responsive images (
srcset), modern formats (WebP, AVIF), lazy loading below the fold. - Render-blocking third-party scripts. Live chat widgets, analytics, A/B testing tools, social pixels — loaded synchronously in the head, blocking everything else. Move them to async, defer, or out of the critical path entirely.
- Web fonts loaded before fallback rendering. Use
font-display: swapso text renders immediately in a system font, then upgrades to the brand font when ready. - Excessive JS bundles. Many WordPress sites ship 500KB+ of unused JS on every page. Tree-shaking, code-splitting, and unloading unused plugins is real work but high impact.
- No HTTP/2, no caching headers, no CDN. Basic server-side hygiene that is invisible until someone looks at the response headers.
What changes after
A site that goes from a Lighthouse mobile score of 35 to 85 typically sees bounce rate fall 10–25%, time-on-site rise meaningfully, and organic traffic begin to climb within a few months as Google re-evaluates the ranking signals. None of that requires a redesign. It requires a developer who knows where to look.
If you have not run your site through PageSpeed Insights in the last six months, do it now. If the numbers are red, that is the first conversation to have — long before you spend on more traffic to feed a leaky funnel.
Common questions
How much does site speed affect conversions? A great deal. A one-second improvement in mobile load time can lift conversions by double digits.
What does a performance audit cover? Core Web Vitals, image and code optimization, server response, render-blocking resources, and mobile experience, with a prioritized fix list.
Is a fast site good for SEO too? Yes. Speed and Interaction to Next Paint are ranking signals, so performance helps rankings and conversions at the same time.